The Monthly report shows how many conversations each of your sources brought in, month by month. It is the report for seeing whether a channel is growing, flat or fading.
Running the report
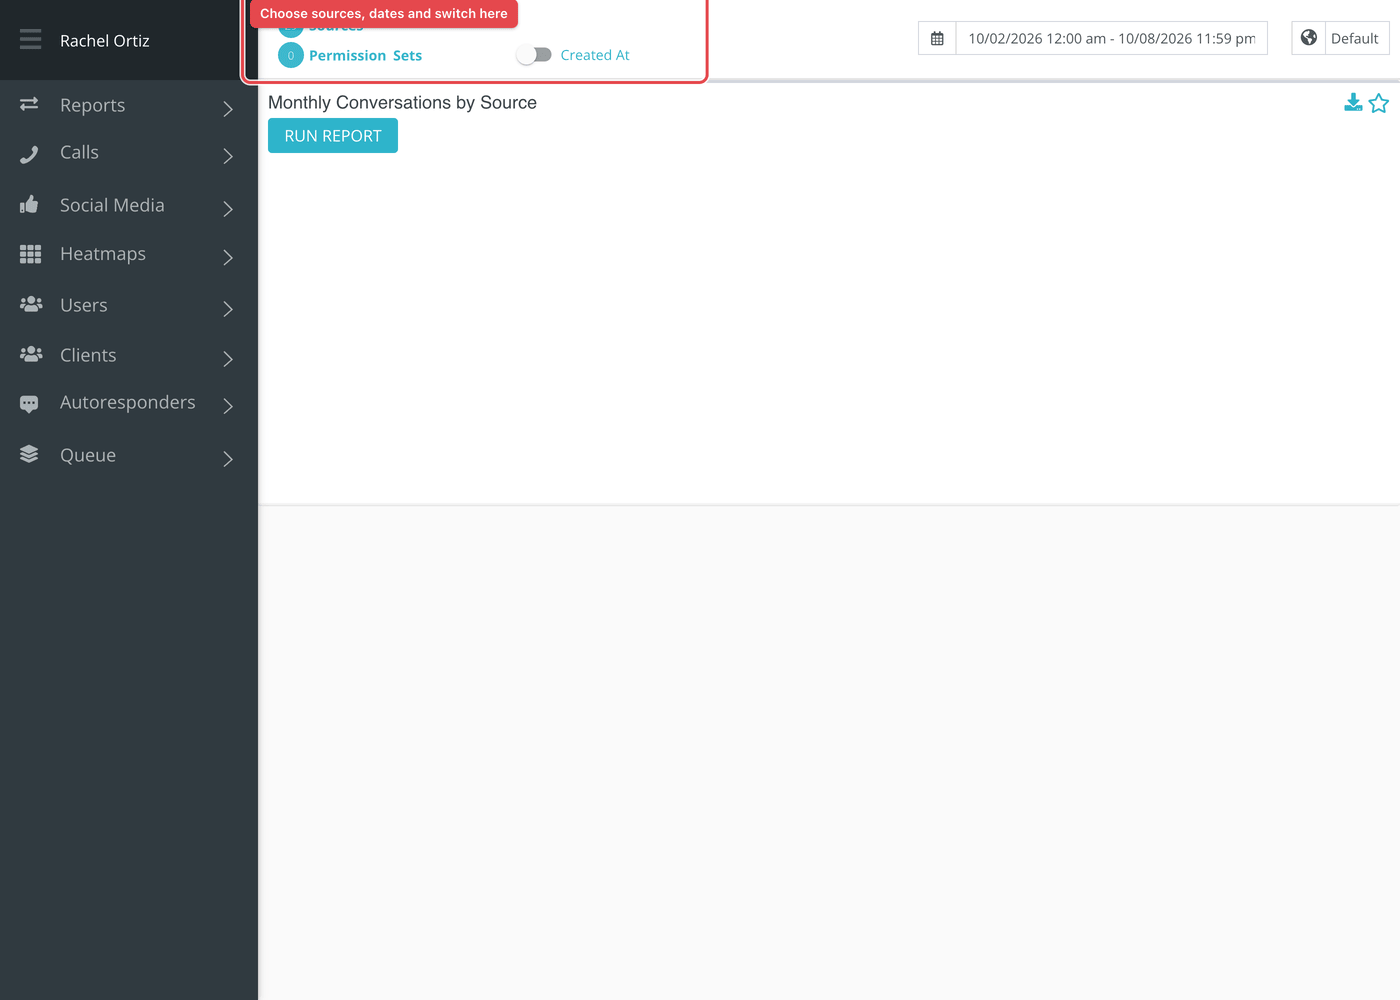
- Open Reports from the main menu. In the left-hand menu, under Reports, click Monthly.
- Click the date range at the top of the page and choose your dates. The globe menu beside it sets the time zone, which starts on your ministry's own.
- Click Sources and choose the conversation sources to include. The number beside it shows how many are chosen.
- Optional: click Permission Sets to count only conversations that someone in those sets claimed. Leave it empty to include everyone.
- Use the switch to choose Created At or Closed At. Created At places a conversation on the day it started. Closed At places it on the day it closed, so conversations that are still open are not counted.
- Click Run Report on each card you want to see. A card does not load until you do, and the button stays gray until you change a filter.
Larger date ranges can take a little while. Reports that are still being built are listed under Queue at the bottom of the left-hand menu, which reads "All Reports Finished Loading" when none are waiting.
Monthly Conversations by Source
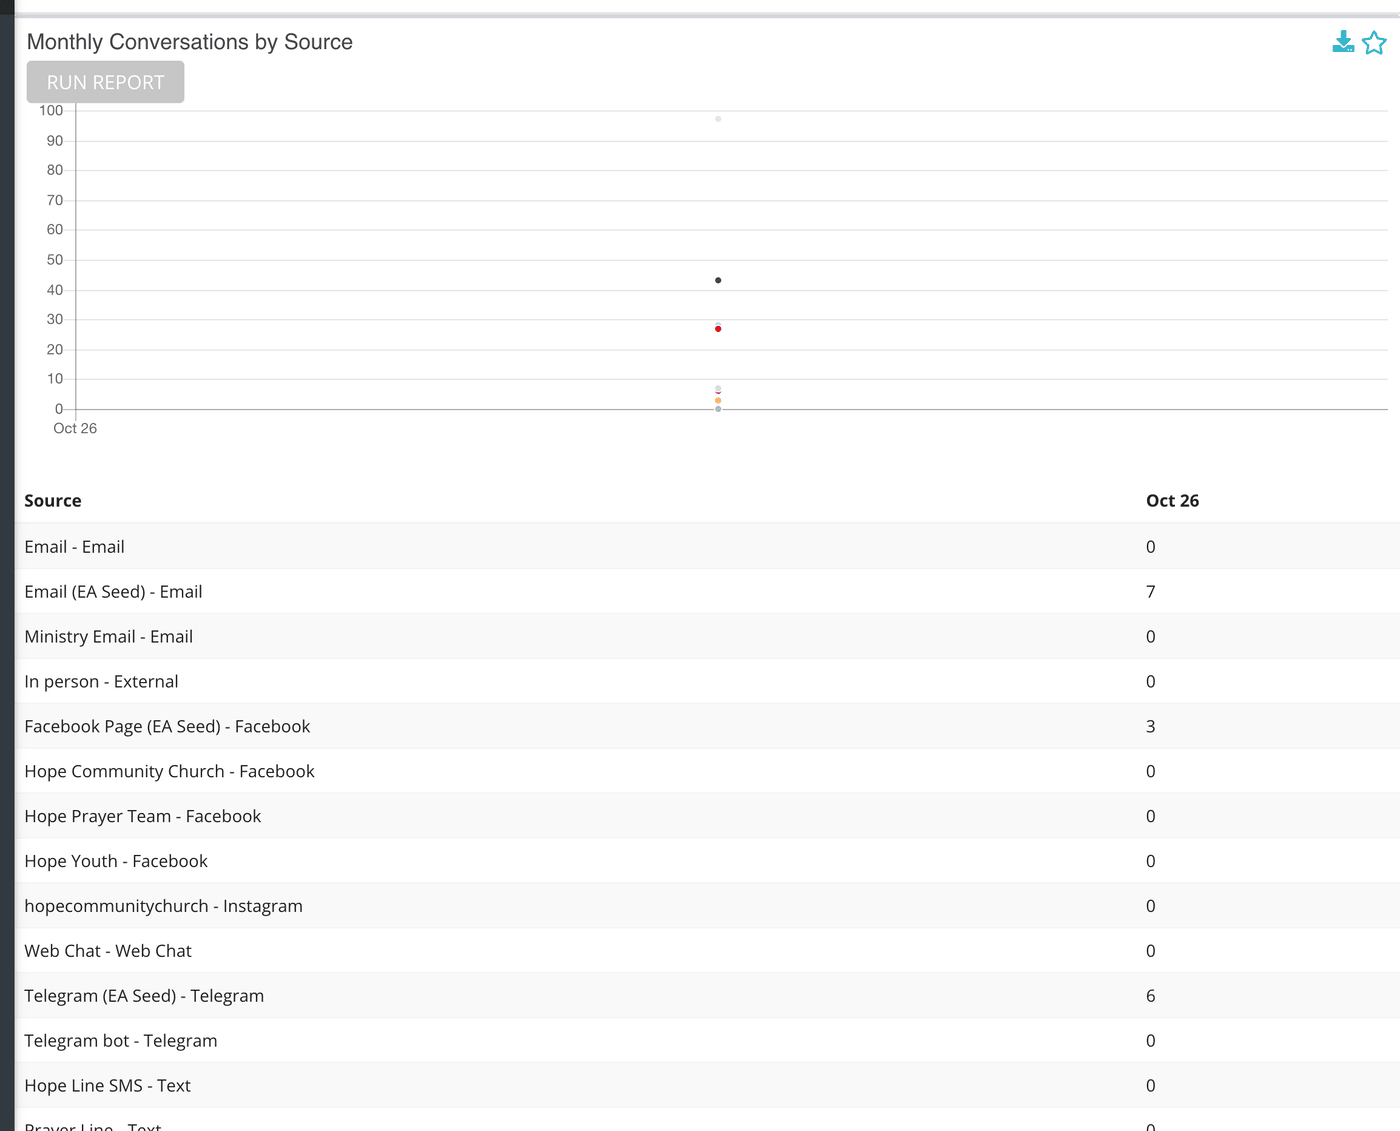
A line chart on top and a table underneath. There is one row for each source you selected, and one column for each calendar month, labeled like Oct 26. Each cell is the number of conversations from that source in that month, or 0.
Each source is drawn as its own line, so you can see which channels move together.
What the measurements mean
| Term | What it means |
|---|---|
| Source | One of your connected ways of being reached, such as a Facebook page, a website chat or a phone number. Sources you have since deleted still appear if you selected them. |
| Month | A whole calendar month in the time zone you picked. |
Things to know
- Every column is a whole month. If your dates start on the 20th, the first column still counts that month from the 1st, and the last column counts to the end of its month.
- A source with no conversations in a month shows 0, not a blank.
- This report counts conversations by source only. To see how they ended, use Monthly Outcomes or Monthly Statuses.
Most cards also carry two small icons beside the title. The star pins the card to your Dashboard. The download icon saves the card as a CSV file, or as XLSX if your download preference is set to XLSX.