The other Users reports look at one stretch of time. This one lays the stretch out month by month, with a column for each month and a row for each responder, so a change in who is doing the work shows up as a pattern across the row.
Where to find it
Click Reports, open the Users group in the left sidebar and click User Trends. The card is titled Monthly User Conversations.

Set up and run the report
- Choose a date range that spans the months you want to compare. The report makes one column for each month the range touches.
- Click Sources and choose the channels to include.
- Click Permission Sets to limit the rows to certain responders. With none chosen, all active responders are included.
- Click Run Report. A long range can take a while, and the report may finish in the background. The Queue section at the bottom of the left sidebar lists reports still loading and says All Reports Finished Loading when none are.

Reading the table
| Column | What it means |
|---|---|
| User | The responder. |
| One column per month, such as Jan 2026 | The number of that responder's conversations that were closed in that month. A dash means none. |
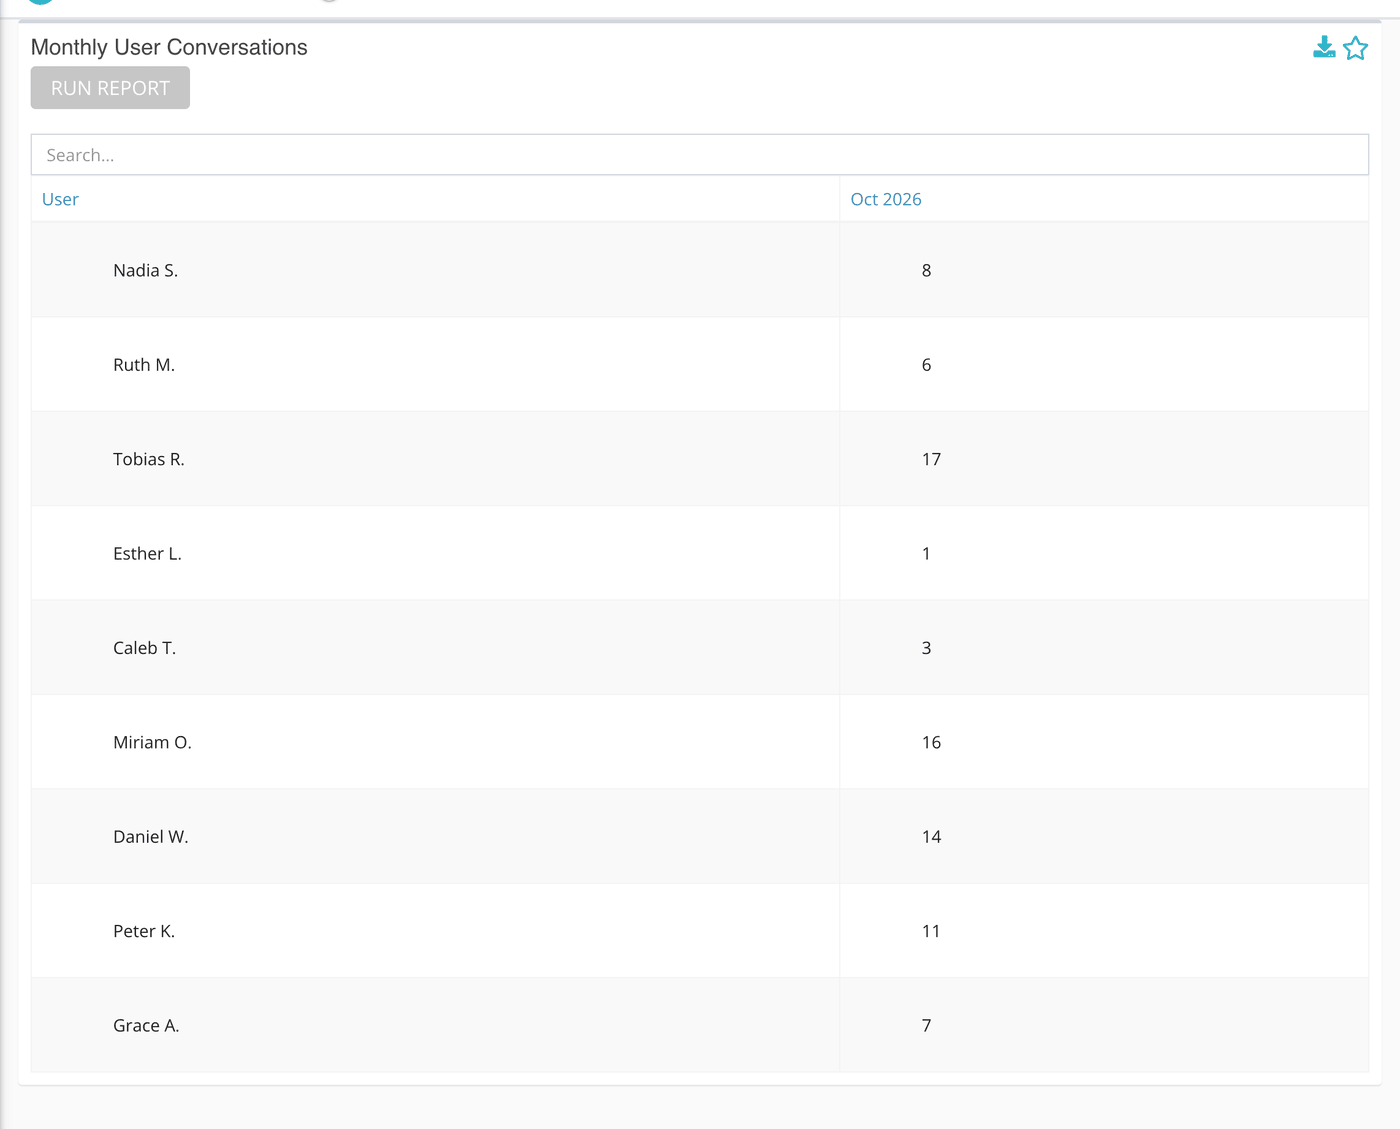
Use the Search box to find a responder and click a month heading to sort by it. A responder with no conversations at all in range does not get a row.
What the measurements mean
| Term | What it means |
|---|---|
| Conversation | A conversation assigned to the responder, from the sources you chose. Phone calls are not included. |
| Month | Each count is placed in the month the conversation was closed. |
What to keep in mind
- The first and last months may be partial months if your range starts or ends mid-month.
- For what those conversations produced, pair this with the Users Convs & Outcomes Report.